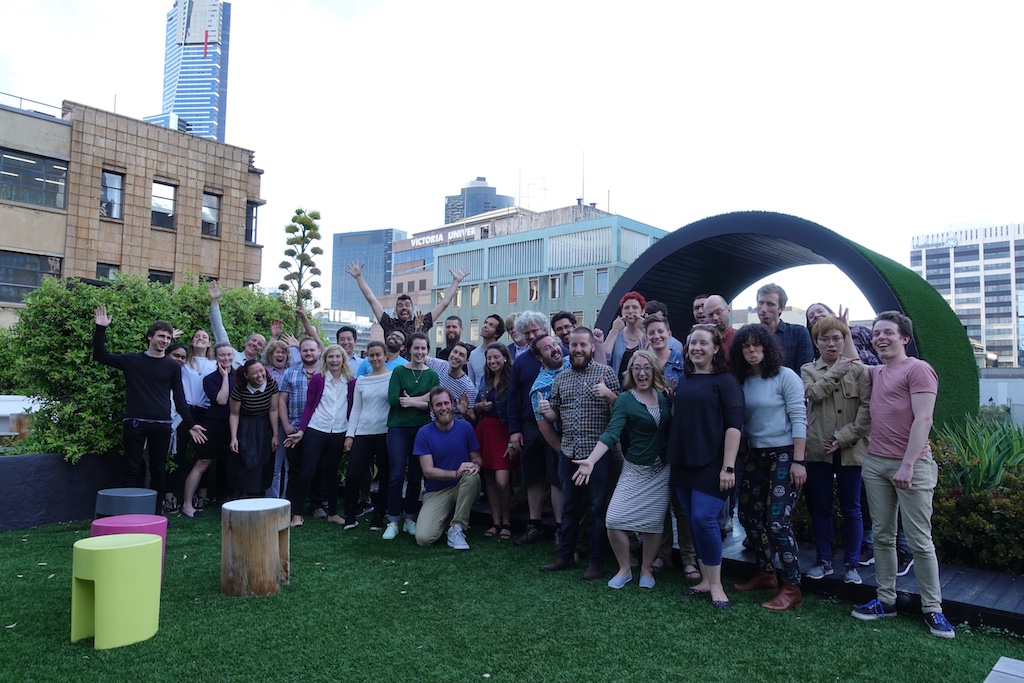
What a great two days I had at rOpenSci’s ozunconf 2017.
- two days of meeting fascinating and friendly new people
- two days filled with great conversations
- two days of learning new things and breaking things
- two days of inspiration
- two days of communal git ups and downs
- two days of not having to explain ‘why R’
Before, during and since the ozunconf I have been the interested in the idea that since actions create data - our own actions in attending and participating generate their own data that would be interesting to analyse.
In this post I’ll attempt to provide some analysis of the github issues that were used as the springboard for discussions and projects at the conference and beyond.
Getting the data from the GitHub GraphQL API
Before the conference, participants were given the option of creating issues for possible selection as projects during the conference and aftwerwards. There were a lot of great ideas and discussion in the comments on each issue. Github offers several API for getting data about a repo and its issues. I am attempting to use Github’s GraphQL API, which is an emerging data query language being used for API by services such as Github, Facebook, Twitter and Pinterest.
Load some packages
# devtools::install_github("ropensci/ghql")
library("ghql")  # creates a graphql client
library("jsonlite") # helps parse JSON
library("httr") # for making web requests and getting the reponse
library(dplyr)  # data wrangling and pipes %>%
library(purrr) # there will be a lot of map / reducing with the returned data
# devtools::install_github("ropenscilabs/icon")
library(icon) # for some cool icons!
# devtools::install_github("ropenscilabs/ochRe")
library(ochRe) # for some Oz color palettes
Create a graphQL Client
If you’ve read this far I am sad to inform you that I have not finished this post. I hope to do so one day….🤷
